Software Quality Survey Results
In April, I conducted a survey to software professionals on the topic of software quality. Today, I present the results from this survey, adapted from my final report.
Introduction
A literature review on software quality showed that software quality is a broad topic covering several factors, requiring a diverse set of metrics to adequately evaluate and control. My goal with the survey to software professionals was to compare their opinions of the definition of software quality with the definitions found in the literature, and to understand how well-known and utilized software methods, metrics, and visualizations are within software teams.
Guiding questions for the survey included:
- How do software professionals define quality?
- What methods do teams most frequently use for improving quality?
- How often do teams/companies manage quality through metrics and visualizations?
- How well do developers know available software quality metrics?
- How likely are software professionals to make use of metric visualization tools for monitoring software quality during software evolution?
Background
The survey consisted of 23 questions, and was administered online using kwiksurveys.
In total, 75 responses across 21 countries and more than 17 companies—not all subjects specified their place of work—were accumulated. The table below shows the full breakdown of the frequency of responses by country.
| Count |
Countries |
|---|
| 33 |
United States |
| 6 |
Germany |
| 5 |
Poland |
| 5 |
United Kingdom |
| 4 |
Australia |
| 3 |
France |
| 2 |
Argentina, Austria, Canada, India |
| 1 |
Denmark, Hungary, Italy, Lithuania, Netherlands, Romania, Singapore, South Africa, Spain, Sweden, Switzerland |
Responders averaged 10.2 years of software industry experience and identified themselves into the following breakdown of job roles (approx.): 79% developers, 16% managers, 4% test/QA engineers, and 1% business analysts.
Over half (50.7%) of the responders identified as working for a company with 6–50 employees, while another significant portion (30.7%) identified as working for companies with greater than 1,000 employees.
The vast majority of responders (89.3%) identified as working within teams of 10 or less, almost evenly split between a size of 1–5 (49.3%) and a size of 6–10 (40.0%). See the tables below for the full distribution of responders' company and team sizes.
Company-size distribution.
| Size |
Count |
% |
|---|
| up to 5 |
9 |
12.0 |
| up to 50 |
29 |
38.7 |
| up to 250 |
8 |
10.7 |
| up to 1,000 |
6 |
8.0 |
| over 1,000 |
23 |
30.7 |
Team-size distribution.
| Size |
Count |
% |
|---|
| up to 5 |
37 |
49.3 |
| up to 10 |
30 |
40.0 |
| over 10 |
8 |
10.7 |
Quality
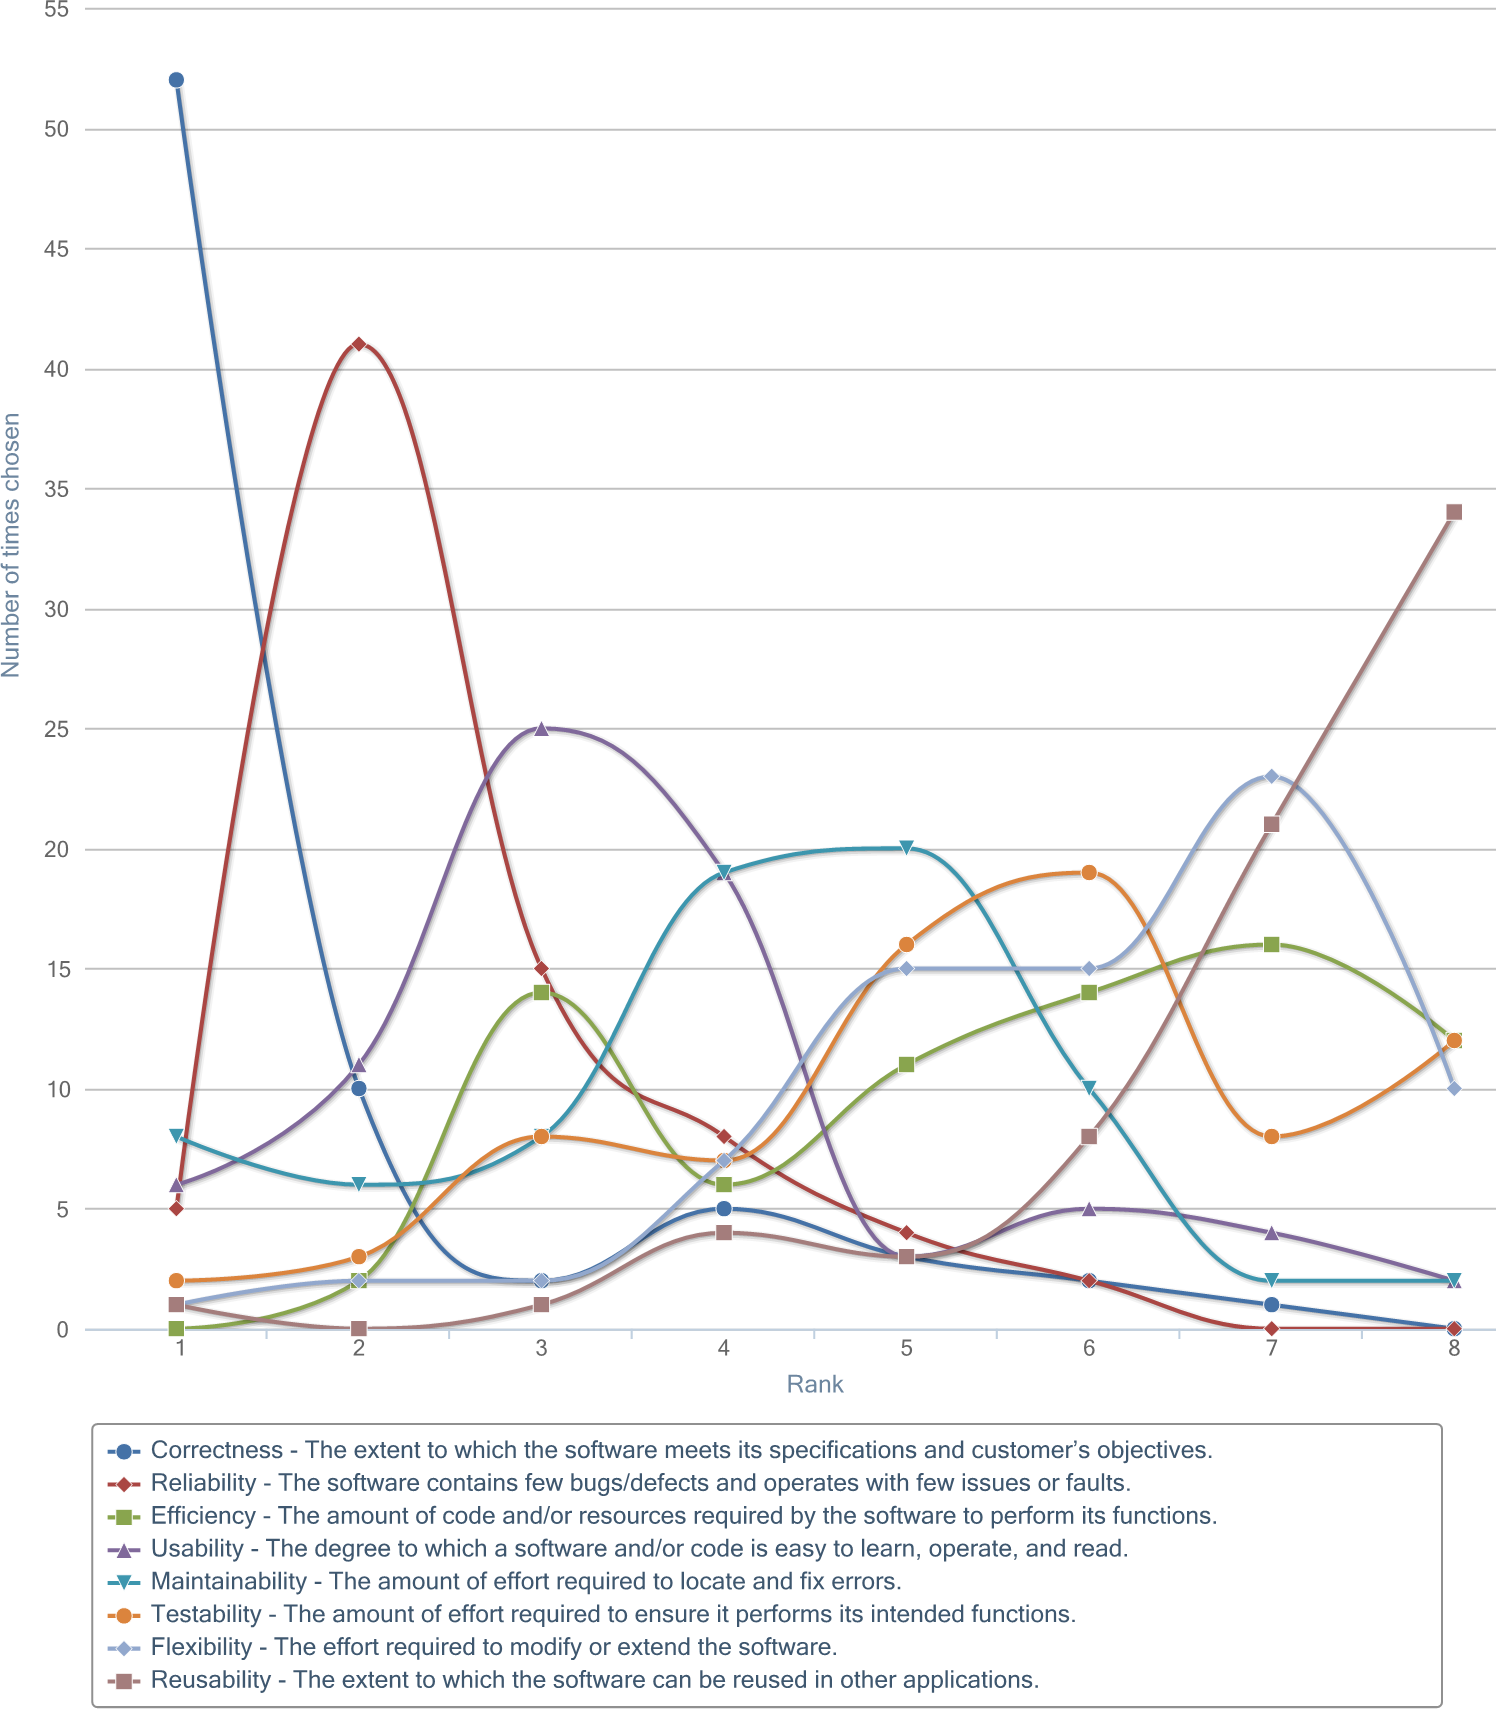
When asked which definition best defines software quality, responders overwhelmingly choose "a broad mix of factors" (77%) over "fit of need" (17%) and "lack of defects" (5%); however, the latter two definitions weighted heavily in the responders' perceptions of quality. When asked to rank a set of eight quality factors in how important the factors represent code quality, Correctness and Reliability were predominantly ranked first and second, respectively.
These results confirm the quality definitions found in the literature, with both the Correctness (i.e. "fit of need") and Reliability (i.e. "defects") attributes standing out from the others.
With quality in manufacturing very much tied to defects and reliability, it is interesting that, here, "lack of defects" was thought to be less important than "fit of need."
The figure below shows a graph of the rank selection distribution for how important the subjects felt each attribute represents quality.
The table below shows the attributes sorted by their weighted-average ranking.
Weighted-average ranks of how important each quality factor is in representing quality.
| Quality factor |
Weighted-average rank (out of 8) |
Median rank (out of 8) |
Mode (out of 8) |
|---|
| Correctness |
1.76 |
1 |
1 |
| Reliability |
2.61 |
2 |
2 |
| Usability |
3.57 |
3 |
3 |
| Maintainability |
4.13 |
4 |
5 |
| Testability |
5.41 |
6 |
6 |
| Efficiency |
5.56 |
6 |
7 |
| Flexibility |
5.93 |
6 |
7 |
| Reusability |
6.97 |
7 |
8 |
By far, the most important attribute was Correctness, which was placed in the first rank by nearly 70% of the subjects. Second, third, and fourth ranks were also clearly shown to be Reliability, Usability, and Maintainability, respectively.
Reusability was clearly the lowest ranked factor, on average, while the remaining three factors (Testability, Efficiency, and Flexibility) were tightly bunched between the fourth and eight ranked factors. While most factors display a single peak within the rank positioning, Efficiency was the only factor that demonstrated two distinct local-maxima (centered around ranks three and seven), suggesting that this factor may have importance in only certain environments or applications.
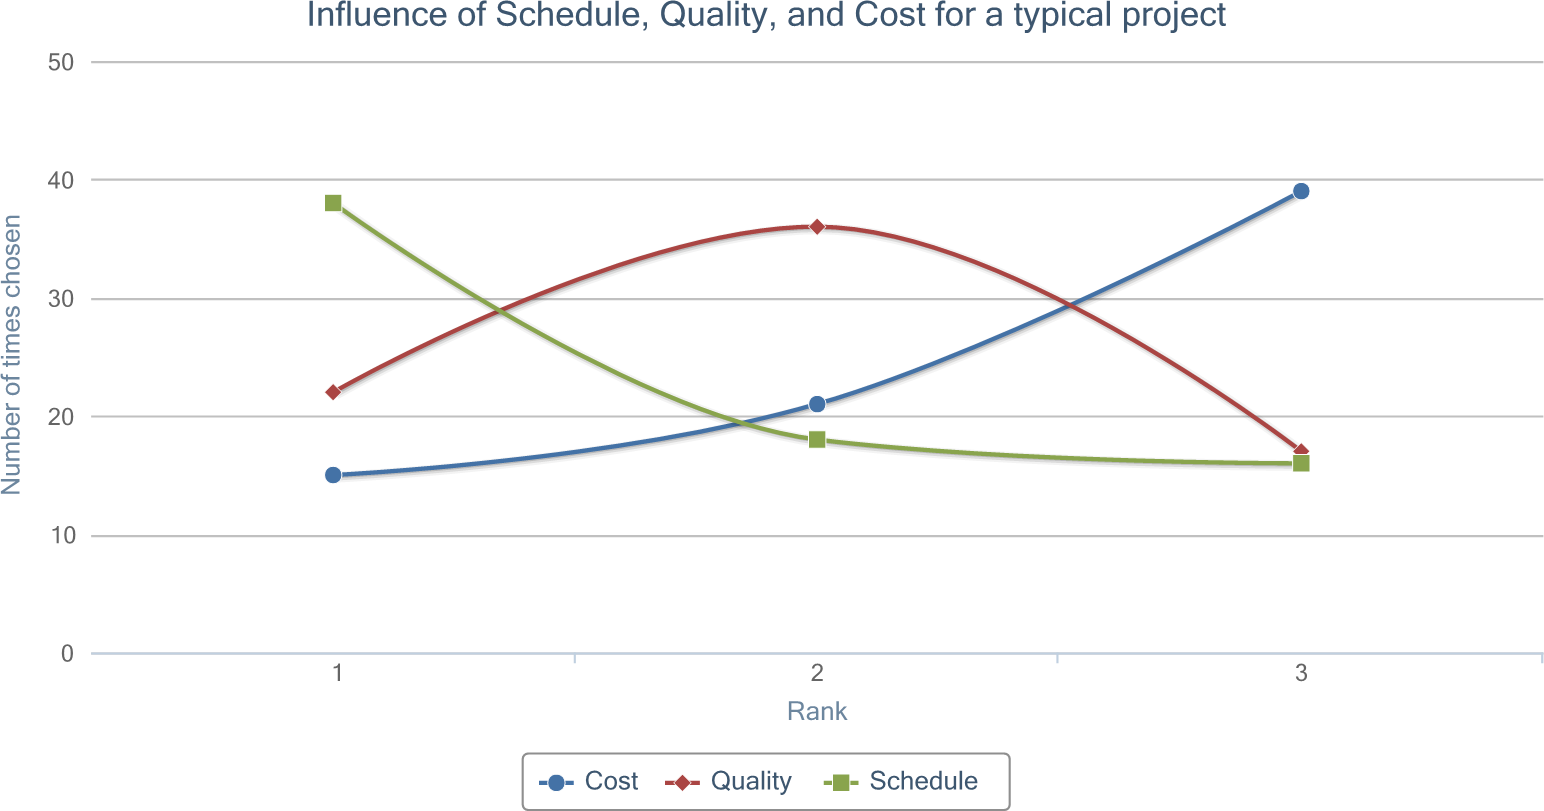
Subjects were then asked to rank three popular trade-off factors (cost, quality, and schedule) in how influential the factors were for a typical software project at their company.
The responses predominantly showed schedule ranked first, quality ranked second, and cost ranked third, with resulting weighted-rank averages of 1.69, 1.93, and 2.32 (out of 3), respectively. The figure below shows the full rank distribution for all three factors.
In a follow-up question to responders who ranked either schedule or cost as more influential than quality, (summarized) reasons given for their selections included:
- Typical projects involve fast-paced, exploratory prototyping.
- Schedule is typically driven by outside factors, such as dependent projects, partner relationships, or regulatory changes.
- Cost and/or schedule are typically the primary focus within contracts.
- Deadlines and schedule receive a high level of focus from management.
- Focus on low cost leads to situations such as the use of less experienced developers who lack the skills to improve quality, or a lack of proper management resources.
Although quality was not ranked as a top consideration for software projects, it was reassuring to learn that the majority of subjects did report on their teams' regular use of multiple methods during the development and/or release process for improving quality. The complete tally of responses can be seen in the table below.
The use of methods during development and/or release processes for improving quality, sorted from most used to least used.
| Method |
Count (of 75) |
% |
|---|
| Informal discussion with colleagues |
63 |
84.0 |
| Automated testing |
59 |
78.7 |
| Human QA testing |
58 |
77.3 |
| Code reviews |
42 |
56.0 |
| Pair programming |
24 |
32.0 |
| Formal meetings |
21 |
28.0 |
| Software metrics |
13 |
17.3 |
| Other |
2 |
2.7 |
The most popular method used was "informal discussion with colleagues" (84.0%), followed closely by "automated testing" (78.7%) and "human quality assurance (QA) testing" (77.3%). The least used method was "software metrics", which received marks from only 17.3% of responders.
The two responses marked "Other" both made mention of static code-analysis tools.
The minimal use of metrics as a method for improving quality is disconcerting since it shows that most development teams do not quantitatively know if, or to what degree, their current quality improvement methods are helping them.
When asked to elaborate on methods used for improving quality, including how and why they are used, the result was a wide range of responses, with most describing choices that were provided in the previous question.
Notable answers not included in the answer choices included: refactoring, bug monitoring, coding guidelines, stress-test tools, branching strategies (e.g. feature branching), and continuing education.
Additional insights gathered on choices that were presented include:
- Related to automated testing were mentions of test-driven development (TDD) and continuous integration.
- Several responses mentioned the fact that automated testing was either under-utilized within their software products, new to their environment, and/or undergoing active improvement.
- Those who mentioned pair programming indicated use of the method for complex or critical bugs and code changes.
- Informal discussions were utilized for completing complex bugs or features, identifying potential issues, learning from problems teammates were facing, and completing changes requiring quick turn-around.
- Code reviews were utilized during new projects, release/sprint iterations, and mentorship situations.
- Human QA testing was used for verifying software correctness and usability, validating releases, and building test plans.
- Responses mentioning formal meetings involved project reviews or retrospectives.
Out of the 75 total subjects, 10 (13.3%) responded that their team does not use any methods for improving quality. Reasons cited included: tight deadlines, lack of time, lack of experience, bad tool support, non-production software, too many projects, lack of management, and team/company culture. The multiple mentions of time constraints here align with the earlier results that show schedule as a more influential trade-off factor on software projects over quality.
Metrics
In the previous section, it was shown that software metrics was the least utilized method for improving quality as part of development processes. However, when asked if their team currently utilizes any metrics for the intentional purpose of improving code quality, just over half of the responders (38 of 75) answered "yes."
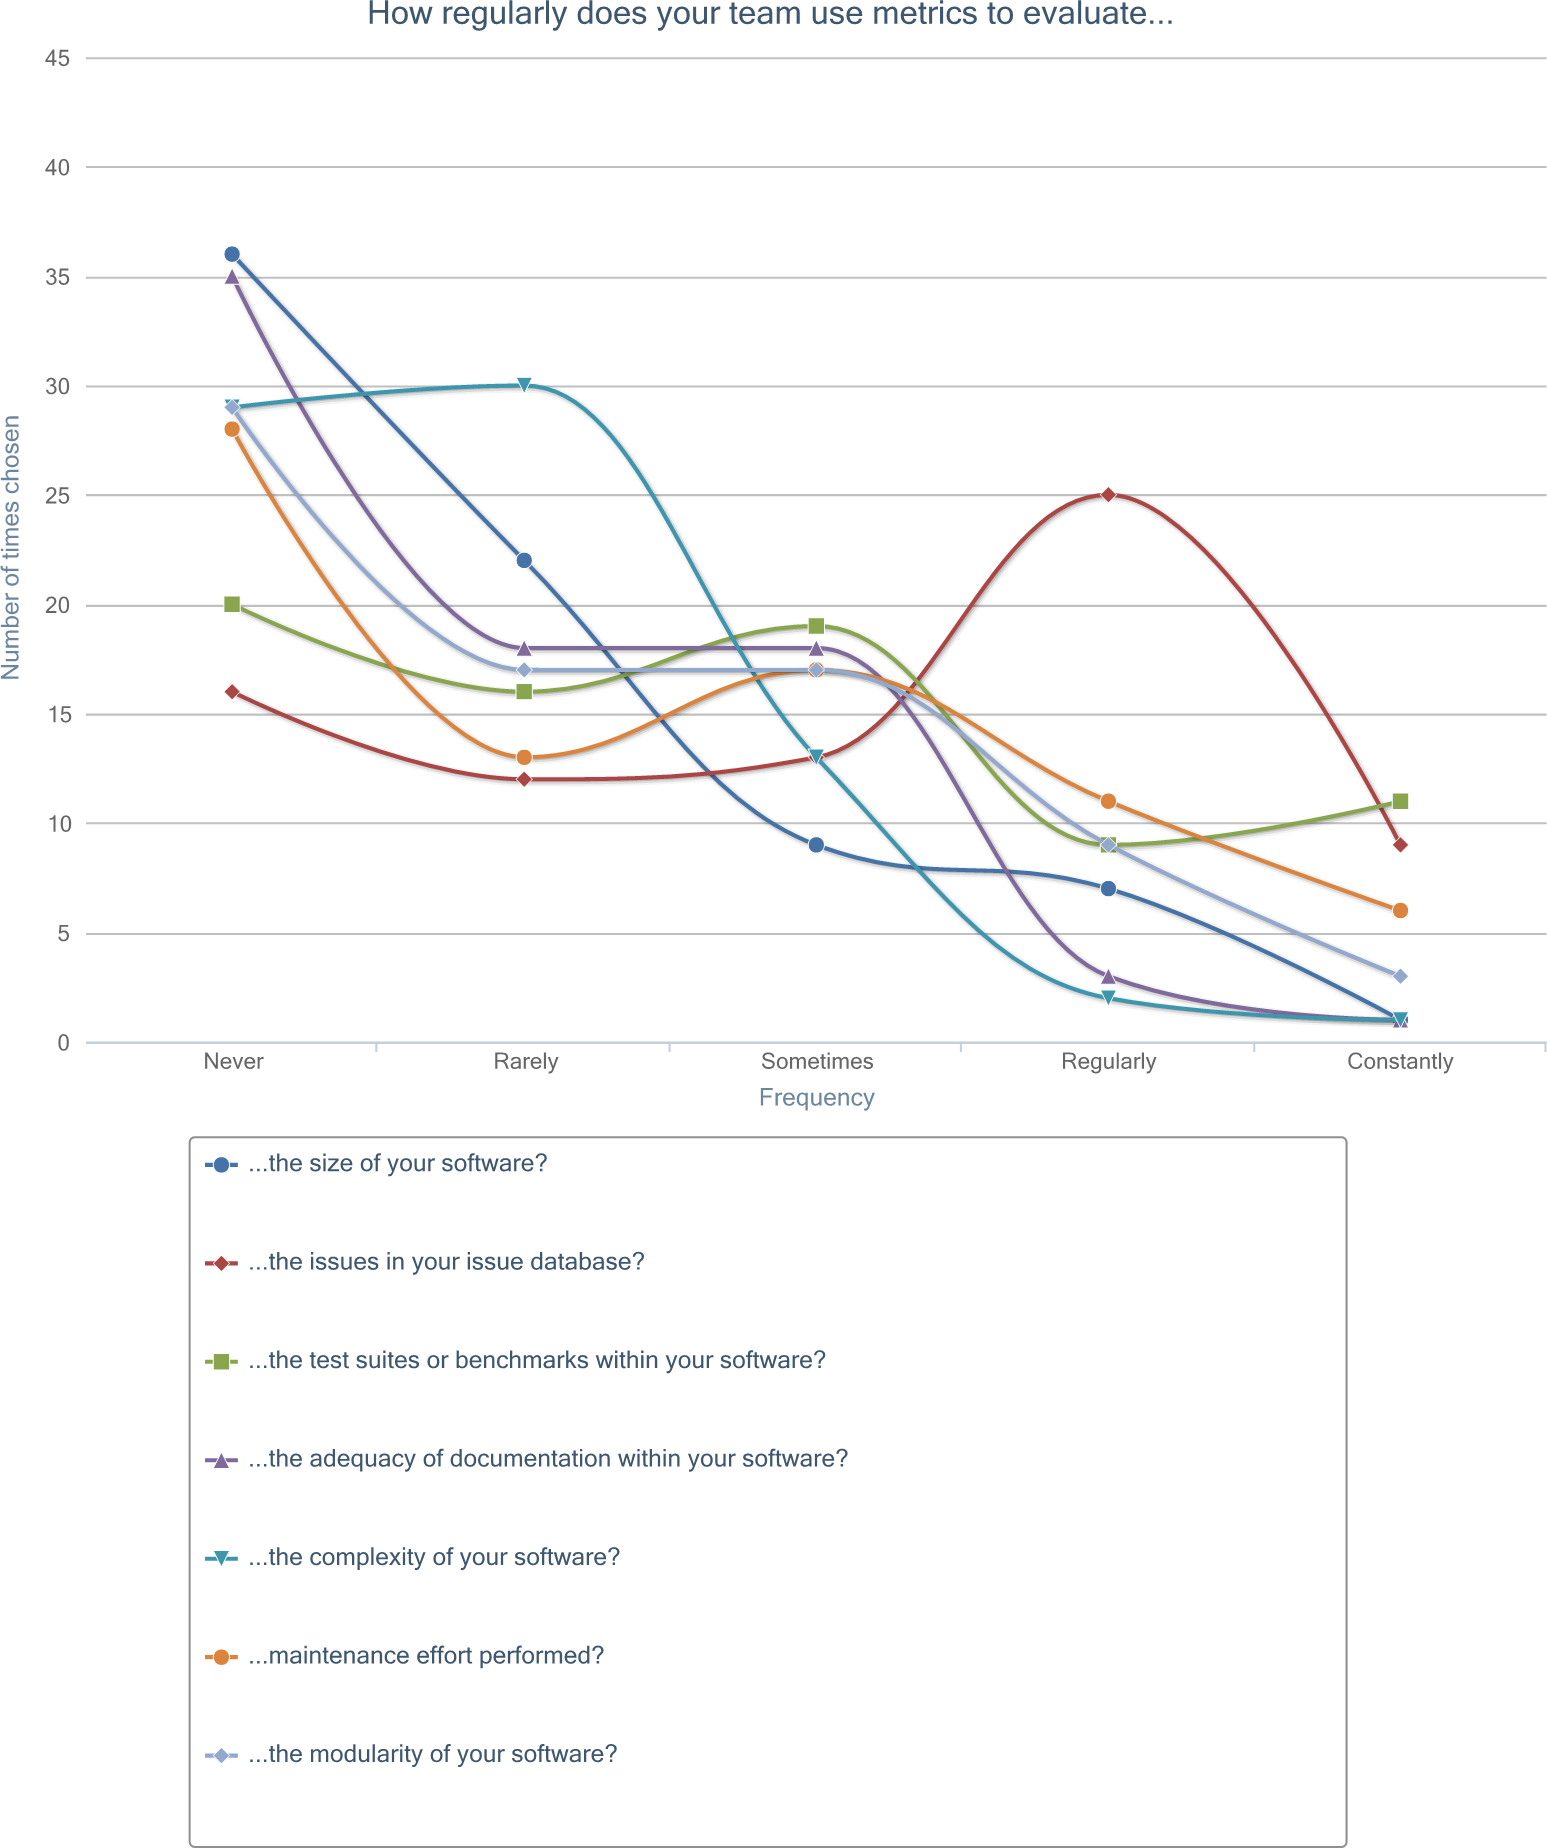
The subjects were then asked how regularly their team used metrics to evaluate seven different areas, which represented a one-to-one mapping to the measurement goals derived in the Goal, Question, Metric (GQM) exercise (not presented here).
Answer choices were a frequency-type Likert scale with the following labels: Never, Rarely, Sometimes, Regularly, Constantly. The figure below depicts the choice distributions for all seven measurement areas, and the table below shows the measurement areas sorted by most frequently used (a weighted-average ordering assuming approximately equal intervals of the frequency-type Likert scale, with values 1 to 5 representing "Never" to "Constantly", respectively).
Frequency that teams make use of metrics to address measurement goals presented in GQM exercise.
| Object of measurement |
Mode |
Median |
Weighted rank (out of 5) |
|---|
| Issues in issue database |
Regularly |
Sometimes |
2.99 |
| Test suites or benchmarks |
Never |
Sometimes |
2.67 |
| Maintenance effort performed |
Never |
Rarely |
2.39 |
| Modularity of software |
Never |
Rarely |
2.20 |
| Adequacy of documentation |
Never |
Rarely |
1.89 |
| Complexity of software |
Rarely |
Rarely |
1.88 |
| Size of software |
Never |
Rarely |
1.87 |
While over half of the responders answered "yes" to currently utilizing metrics for improving code quality, they did so at a very low frequency in each of the measurement areas questioned. Only two areas (issues in issue database and test suites or benchmarks) had a median frequency above "Rarely," and were also not much more utilized themselves with a median frequency of "Sometimes." Likewise, only two areas had a most-selected frequency above "Never"—complexity of software had a mode of "Rarely" and issues in issue database had a mode of "Regularly."
Issues in issue database was the most-frequently utilized metric area, clearly seen as on outlier within the "Regularly" frequency choice in Figure measurement goal frequency. In fact, aside from that single outlying point, there is no metric area for the "Regularly" and "Constantly" frequencies that had more selections than the least-selected metric area for the "Rarely" and "Never" frequencies.
Next, the subjects were asked to rate their knowledge and use of 28 different metrics on a Likert scale consisting of the four choices: Never heard of or do not know, Know of but have not used, Have used before, and Use regularly.
The list of metrics used for the survey was primarily taken from a GQM derivation (omitted from this post), and was found throughout a range of topics in the software engineering literature, including:
- software sizing and effort
- complexity
- defects
- code duplication
- testing
- evolution
- coupling
- cohesion and object-oriented design
- information flow
- people and organizational structure
- various combinations of the proceeding topics
The table below shows the full count (and percentage) breakdown of responses for each metric. The data is sorted by highest weighted average (assuming approximate equal intervals of a Likert scale, weighted from 1 to 4 representing the selections "Never heard of or do not know" to "Use regularly"), which allows identification of the central tendency of selections for each metric.
The knowledge and use of 28 different metrics, sorted by most frequently used and well-known.
| Metric |
Never heard of or do not know |
Know of but have not used |
Have used before |
Use regularly |
Weighted average
(out of 4) |
|---|
| Count |
% |
Count |
% |
Count |
% |
Count |
% |
|---|
| Unit test failures or pass/fail ratio |
4 |
5.3 |
10 |
13.3 |
29 |
38.7 |
32 |
42.7 |
3.19 |
| Line coverage |
5 |
6.7 |
24 |
32.0 |
30 |
40.0 |
16 |
21.3 |
2.76 |
| Lines of code |
2 |
2.7 |
29 |
38.7 |
32 |
42.7 |
12 |
16.0 |
2.72 |
| Number of classes/functions/files/modules |
5 |
6.7 |
32 |
42.7 |
27 |
36.0 |
11 |
14.7 |
2.59 |
| Branch/path coverage |
14 |
18.7 |
25 |
33.3 |
26 |
34.7 |
10 |
13.3 |
2.43 |
| Duplicated code (or code clone) percentage |
9 |
12.0 |
33 |
44.0 |
27 |
36.0 |
6 |
8.0 |
2.40 |
| Defect count or distribution |
14 |
18.7 |
38 |
50.7 |
16 |
21.3 |
7 |
9.3 |
2.21 |
| Time-to-fix defect |
13 |
17.3 |
44 |
58.7 |
13 |
17.3 |
5 |
6.7 |
2.13 |
| Cyclomatic complexity |
22 |
29.3 |
26 |
34.7 |
23 |
30.7 |
4 |
5.3 |
2.12 |
| Depth of nesting |
15 |
20.0 |
38 |
50.7 |
21 |
28.0 |
1 |
1.3 |
2.11 |
| Function points or similar |
29 |
38.7 |
24 |
32.0 |
17 |
22.7 |
5 |
6.7 |
1.97 |
| Coupling |
26 |
34.7 |
29 |
38.7 |
17 |
22.7 |
3 |
4.0 |
1.96 |
| Depth of inheritance tree |
20 |
26.7 |
39 |
52.0 |
15 |
20.0 |
1 |
1.3 |
1.96 |
| Cohesion (or lack of cohesion) |
27 |
36.0 |
31 |
41.3 |
14 |
18.7 |
3 |
4.0 |
1.91 |
| Defect density |
24 |
32.0 |
40 |
53.3 |
6 |
8.0 |
5 |
6.7 |
1.89 |
| Mean time between defect/error |
18 |
24.0 |
49 |
65.3 |
6 |
8.0 |
2 |
2.7 |
1.89 |
| Code churn, turnover ratio, or edit frequency |
26 |
34.7 |
39 |
52.0 |
10 |
13.3 |
0 |
0.0 |
1.79 |
| Number of engineers |
30 |
40.0 |
34 |
45.3 |
8 |
10.7 |
3 |
4.0 |
1.79 |
| Fan-in and fan-out (class/module dependencies) |
38 |
50.7 |
24 |
32.0 |
11 |
14.7 |
2 |
2.7 |
1.69 |
| Number of ex-engineers |
35 |
46.7 |
34 |
45.3 |
4 |
5.3 |
2 |
2.7 |
1.64 |
| Defect slippage ratio |
41 |
54.7 |
30 |
40.0 |
4 |
5.3 |
0 |
0.0 |
1.51 |
| Percentage of org contributing to development |
48 |
64.0 |
23 |
30.7 |
4 |
5.3 |
0 |
0.0 |
1.41 |
| Overall organization ownership |
54 |
72.0 |
17 |
22.7 |
4 |
5.3 |
0 |
0.0 |
1.33 |
| Level of organizational code ownership |
56 |
74.7 |
15 |
20.0 |
4 |
5.3 |
0 |
0.0 |
1.31 |
| Depth of master ownership |
59 |
78.7 |
12 |
16.0 |
4 |
5.3 |
0 |
0.0 |
1.27 |
| Halstead metrics |
58 |
77.3 |
16 |
21.3 |
1 |
1.3 |
0 |
0.0 |
1.24 |
| Mutant killing percentage |
60 |
80.0 |
13 |
17.3 |
2 |
2.7 |
0 |
0.0 |
1.23 |
| Organization intersection factor |
61 |
81.3 |
11 |
14.7 |
3 |
4.0 |
0 |
0.0 |
1.23 |
From the data collected, several insights were captured:
- No metric was used regularly by a majority of the responders. The only metric that came close (42.7%) was Unit test failures or pass/fail ratio.
- Only four metrics have been used before or were used regularly by a majority of responders: Unit test failures or pass/fail ratio, Line coverage, Lines of code, and Number of classes/functions/files/modules. These four metrics were also the only ones that were both unknown to less than 10% of responders and used regularly by more than 10% of responders.
- Aside from the four metrics mentioned in the previous bullet, Branch/path coverage was the only other metric that was used regularly by more than 10% of the responders; however, a higher percentage of responders (19%) had never heard of this metric (about three times more than the four metrics mentioned above).
- Several metrics were highly known, yet not used before or used regularly, including: Mean time between defect/error, Time-to-fix defect, Defect density, Code churn, Depth of inheritance tree, Depth of nesting, and Defect count or distribution. It us unknown, however, if the high levels of knowledge of these metrics are due to familiarity of their use within the software industry or rather due to the ease of which their definitions can be gleaned from their names.
- Nearly one-third of the metrics presented were completely unknown by a majority of responders, with most metrics in this group used regularly by zero responders and used before by about 5% or less of responders. Metrics in this group consisted of Fan-in and fan-out, Defect slippage ratio, Halstead metrics, Mutant killing percentage, and several of the people and organizational metrics described by Zimmermann et. al .
The final two questions in the survey related to metrics were on the topic of the use of metrics to evaluate employee performance. About 15% of responders indicated that their company uses software metrics for evaluating employee performance. Surprisingly, nearly twice that amount (28.0%) either agreed or strongly agreed with the use of metrics for evaluating employee performance.
The full results can been seen in the table below, broken down by manager and non-manager roles (as identified earlier in the survey, see Background).
Level to which responders agree with using software metrics to evaluate employee performance, broken down by manager and non-manager roles.
| Role |
Count |
Percentage of Responders |
|---|
| Strongly Disagree |
Disagree |
Neutral |
Agree |
Strongly Agree |
|---|
| Managers |
12 |
16.7 |
16.7 |
8.3 |
50.0 |
8.3 |
| Non-managers |
63 |
17.5 |
23.8 |
36.5 |
19.1 |
3.2 |
| Total |
75 |
17.3 |
22.7 |
32.0 |
24.0 |
4.0 |
From the manager vs. non-manager results, we expectedly see that those in manager roles were much more likely to agree (50.0%) or strongly agree (8.3%) than were those in non-manager roles. Those in non-manager roles were most likely to be neutral (32.0%) or to disagree (23.8%). Both manager and non-manager roles differed by less than 1% in the strongly disagree segment and, in aggregate, very few (4.0%) responders identified as strongly agreeing with the use of metrics for employee performance evaluation.
Visualization
The survey to software professionals also included four questions on the topic of visualizing software metrics.
Overall, responders overwhelmingly felt that it would be useful to visualize metrics about their software projects over time, with over 81% who either agreed or strongly agreed with this statement and less than 6% who either disagreed or strongly disagreed. However, when asked if their team currently uses any tools to visualize software metrics over time, less than 30% answered "yes."
In a similar question, subjects were asked how likely they would be to use a software metrics visualization tool to help improve the quality of software they write. Here, responders were also positive, albeit slightly less enthusiastic. The majority of responders fell into the likely (42.7%) or neutral (25.3%) segments, with an equal percentage (14.6%) in both the unlikely and very likely segments. The full results for these two questions can be seen in the tables below.
From these results, combined with the earlier result that just over half of the responders answering "yes" to their team currently utilizing metrics for improving code quality, there clearly exists a gap between those who use metrics and those who use metrics visualizations.
Additionally, the positive responses to the perceived usefulness of metrics visualizations, and willingness to use metrics visualizations, suggests there is opportunity and demand for such tools.
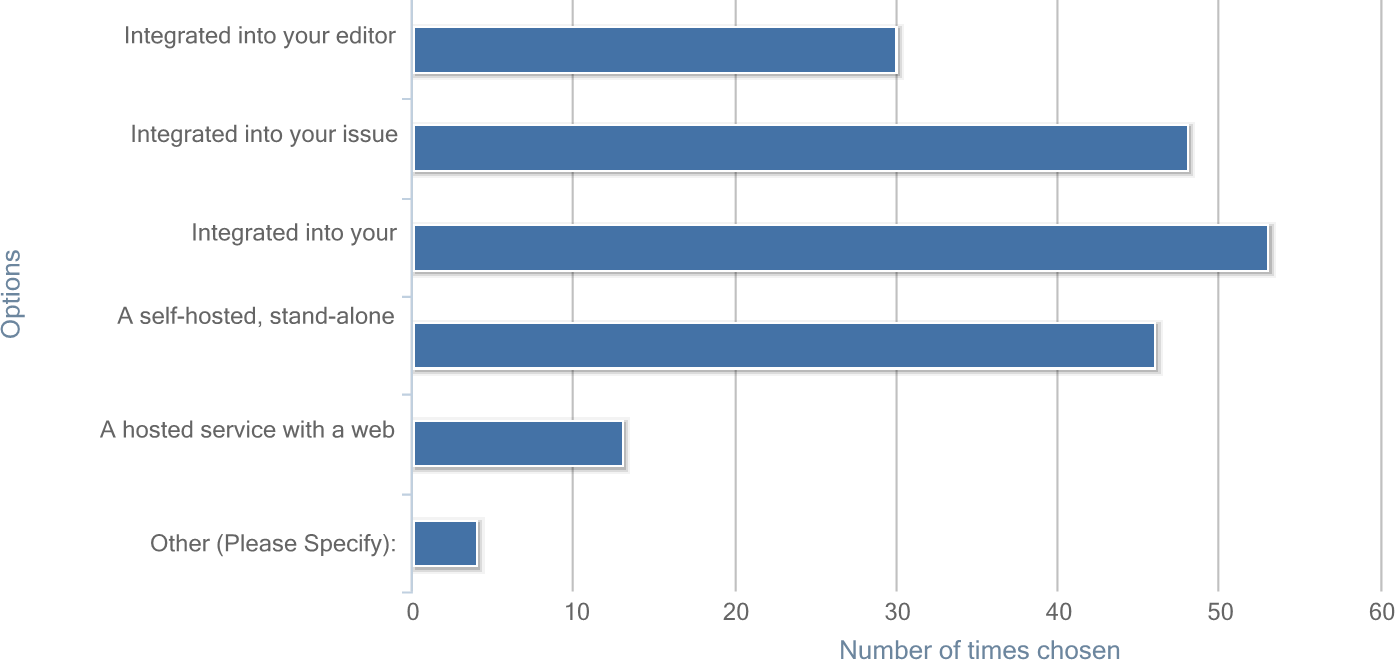
On the topic of visualization tools, subjects were asked how they would like to use such a tool (see figure below for a chart of all responses). The most popular choices, selected by about 61--71% of the responders, were: integrated into build/test server, integrated into issue tracker, and a self-hosted, stand-alone product with web interface. Least popular were: integrated into editor/IDE and a hosted service with web interface. Four responders filled in a selection for other, mentioning a dedicated build server, as well as a script or command-line interface.
References
| [4] | Rajiv D. Banker, Srikant M. Datar, Chris F. Kemerer, and Dani Zweig. Software complexity and maintenance costs. Commun. ACM, 36(11):81–94, Nov. 1993. |